
Gunakan langkahmudah berikut ini untuk memulai menggunakan Delphi TChart component:
- Masukkan Komponen TChart kedalam form
- Double Click pada chart lalu anda akan melihat dialog box.
- Click tombol add idi series tab sheet.
- Pilih Chart style pada daftar
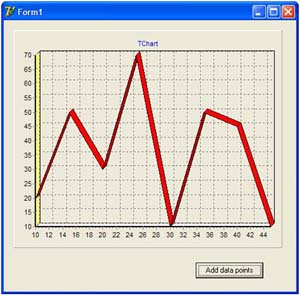
Put following code to add data into the chart
01.procedure TForm1.Button1Click(Sender: TObject);02.begin03. { function AddXY(Const AXValue, AYValue: Double;04. Const AXLabel: String; AColor: TColor) : Longint;05. 06. This function inserts a new point in the Series.07. The new point has X and Y values. The AXLabel08. parameter is optional (can be empty ''). The AColor09. parameter is optional (can be clTeeColor).10. The function returns the new point position in the11. Values list. }12. Chart1.Series[0].AddXY(10, 20, '', clTeeColor);13. Chart1.Series[0].AddXY(15, 50, '', clTeeColor);14. Chart1.Series[0].AddXY(20, 30, '', clTeeColor);15. Chart1.Series[0].AddXY(25, 70, '', clTeeColor);16. Chart1.Series[0].AddXY(30, 10, '', clTeeColor);17. Chart1.Series[0].AddXY(35, 50, '', clTeeColor);18. Chart1.Series[0].AddXY(40, 45, '', clTeeColor);19. Chart1.Series[0].AddXY(45, 10, '', clTeeColor);20. 21. { Or you can write following code using "With" statement.22. Its much easier than repeating everything again and again.23. 24. With Chart1.Series[0] Do25. Begin26. AddXY(10, 20, '', clTeeColor);27. AddXY(15, 50, '', clTeeColor);28. AddXY(20, 30, '', clTeeColor);29. AddXY(25, 70, '', clTeeColor);30. AddXY(30, 10, '', clTeeColor);31. AddXY(35, 50, '', clTeeColor);32. AddXY(40, 45, '', clTeeColor);33. AddXY(45, 10, '', clTeeColor);34. End;35. }36.end;
No comments:
Post a Comment